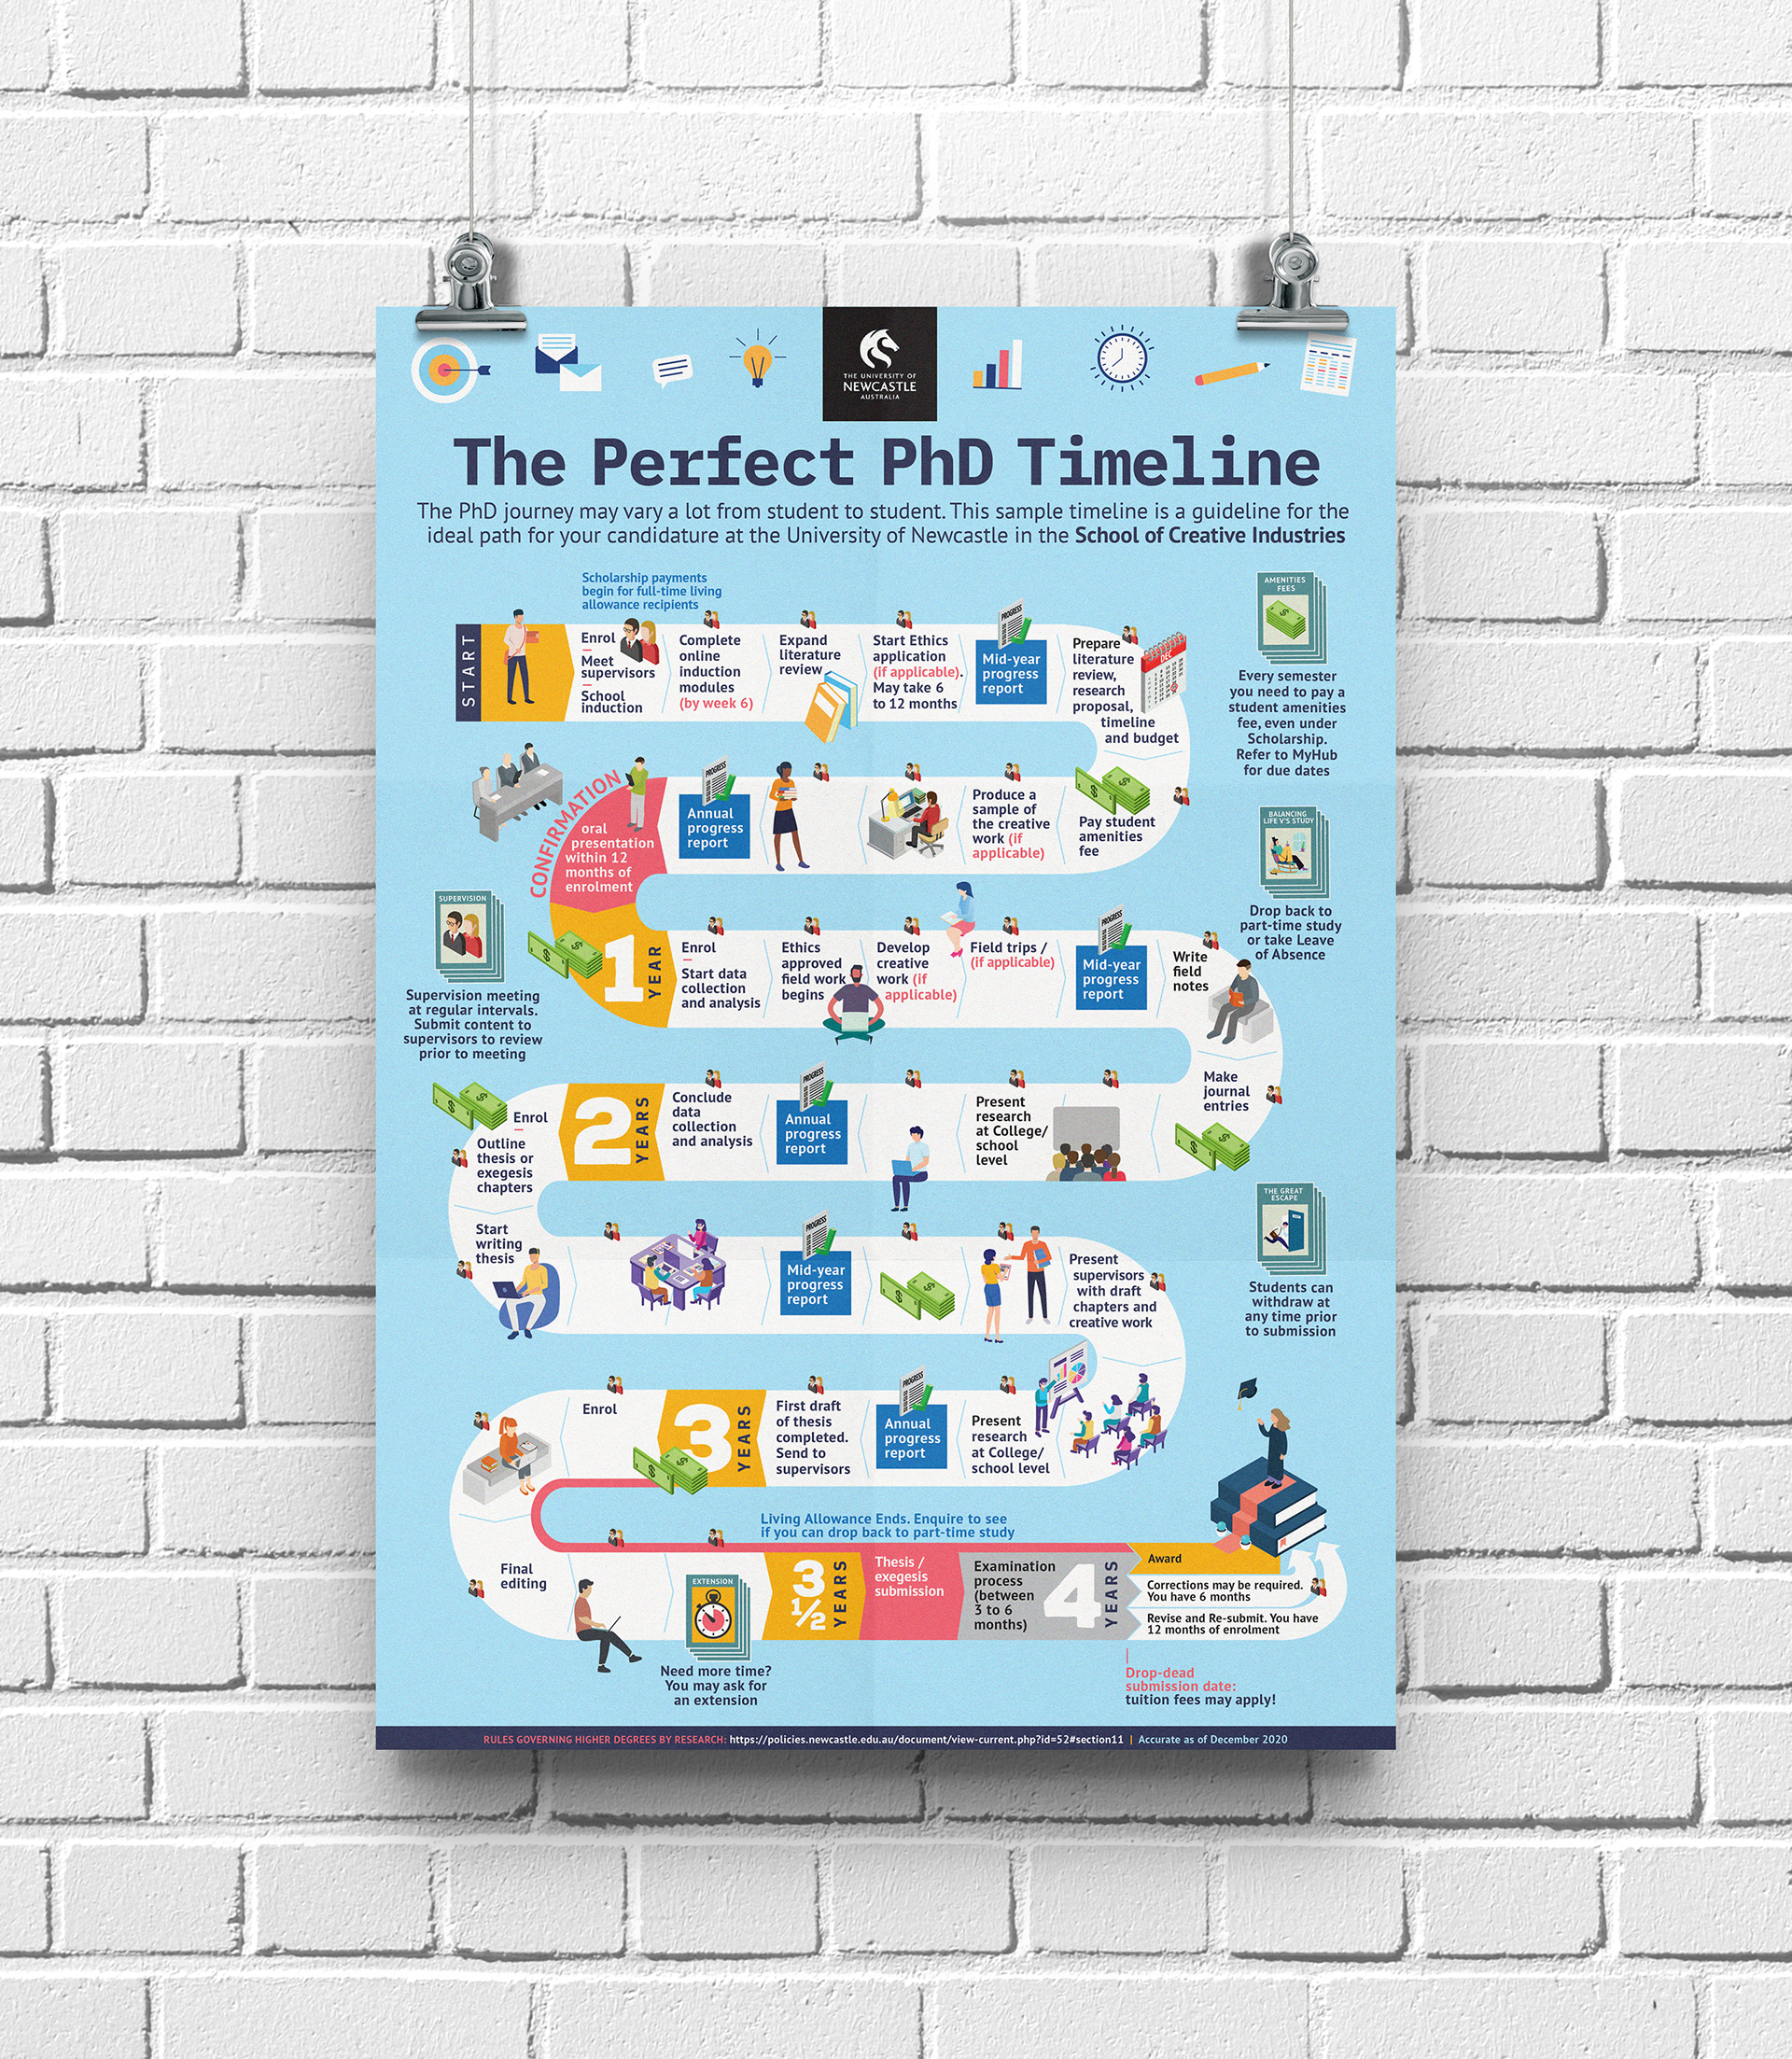
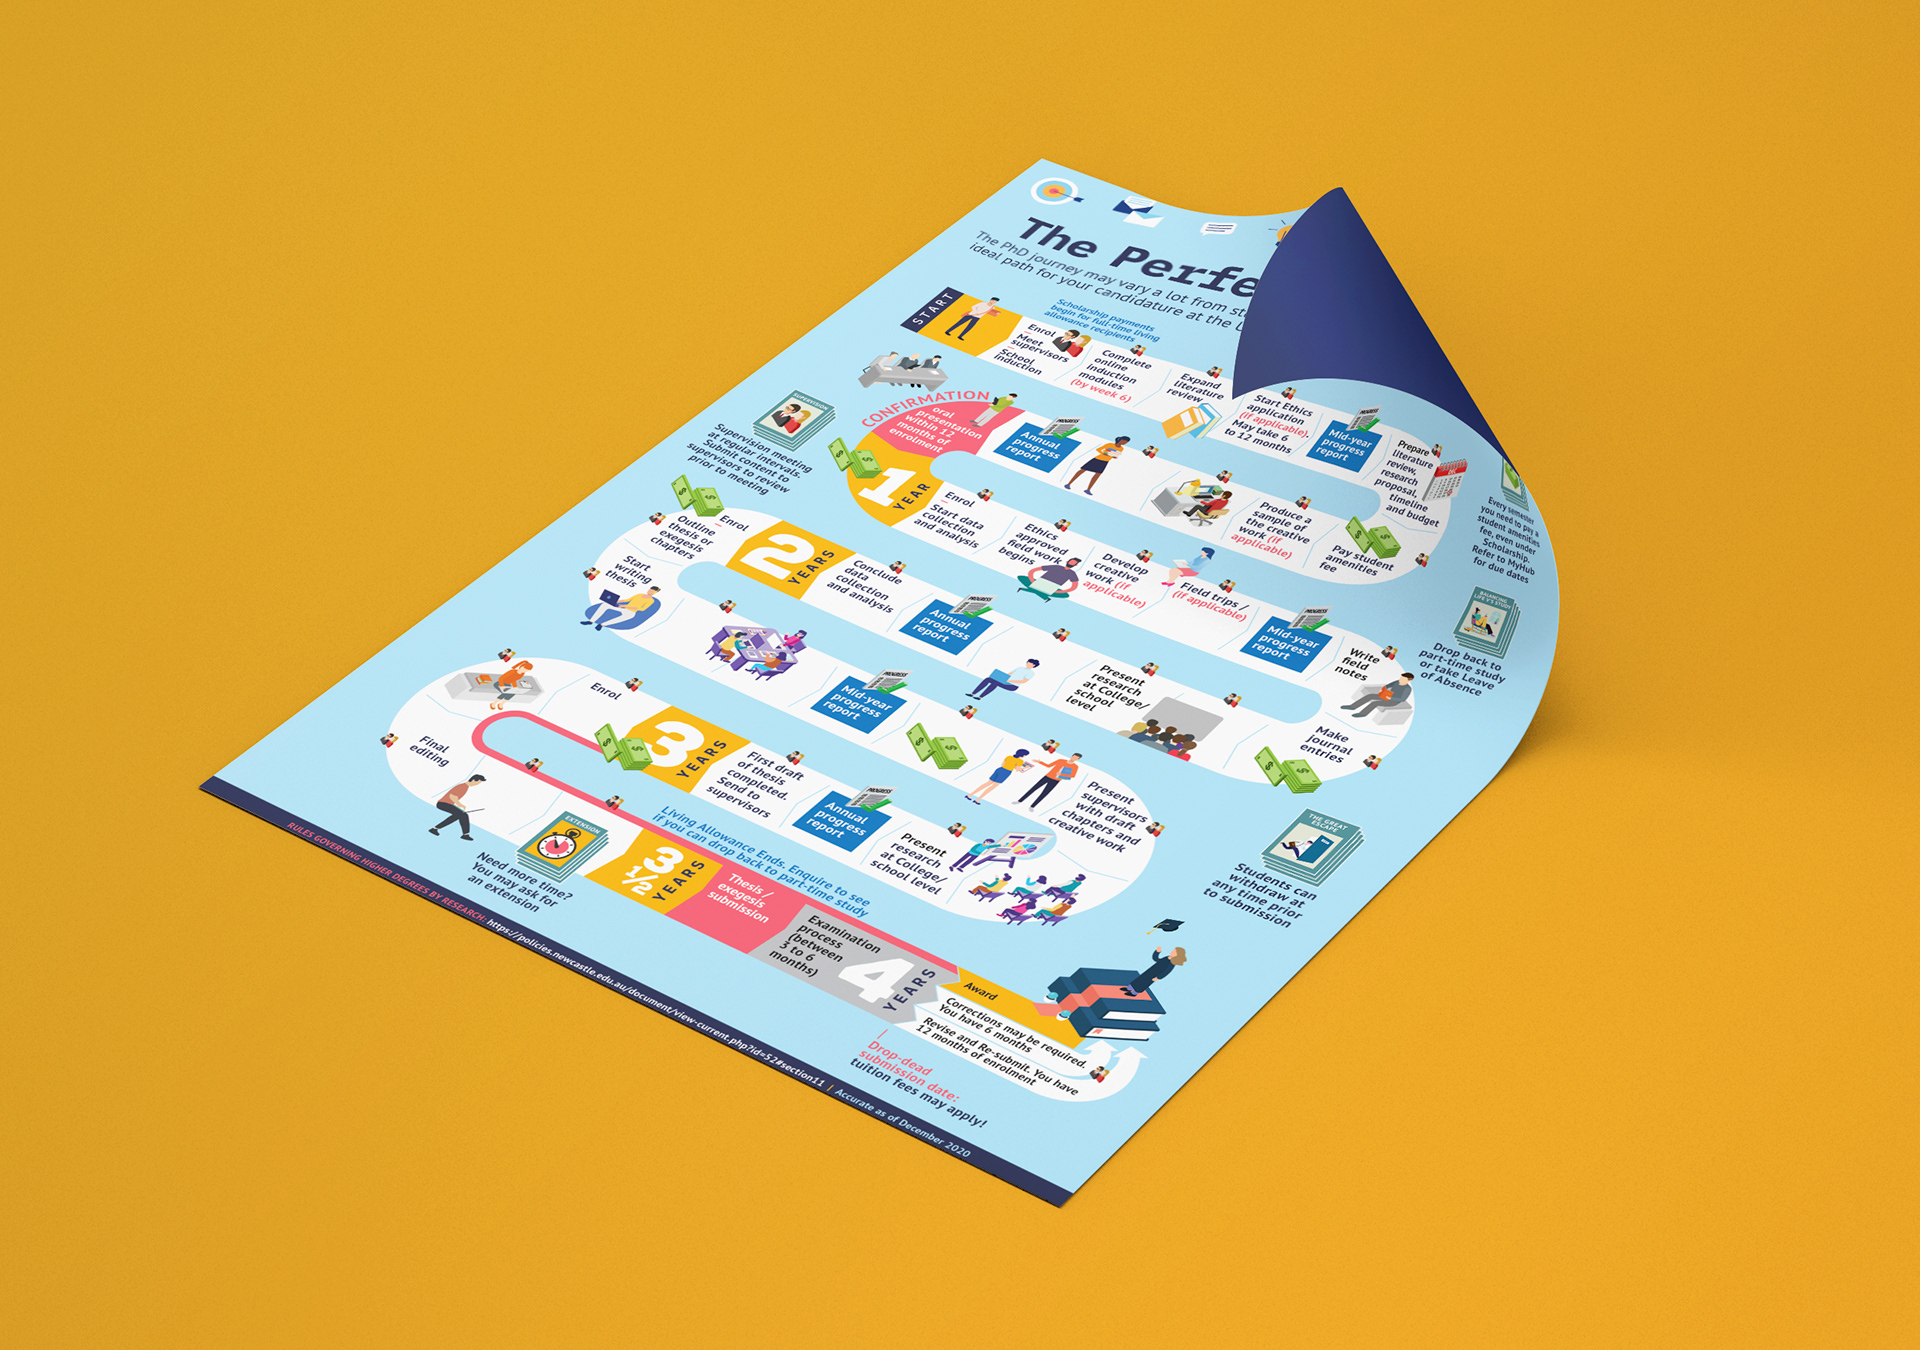
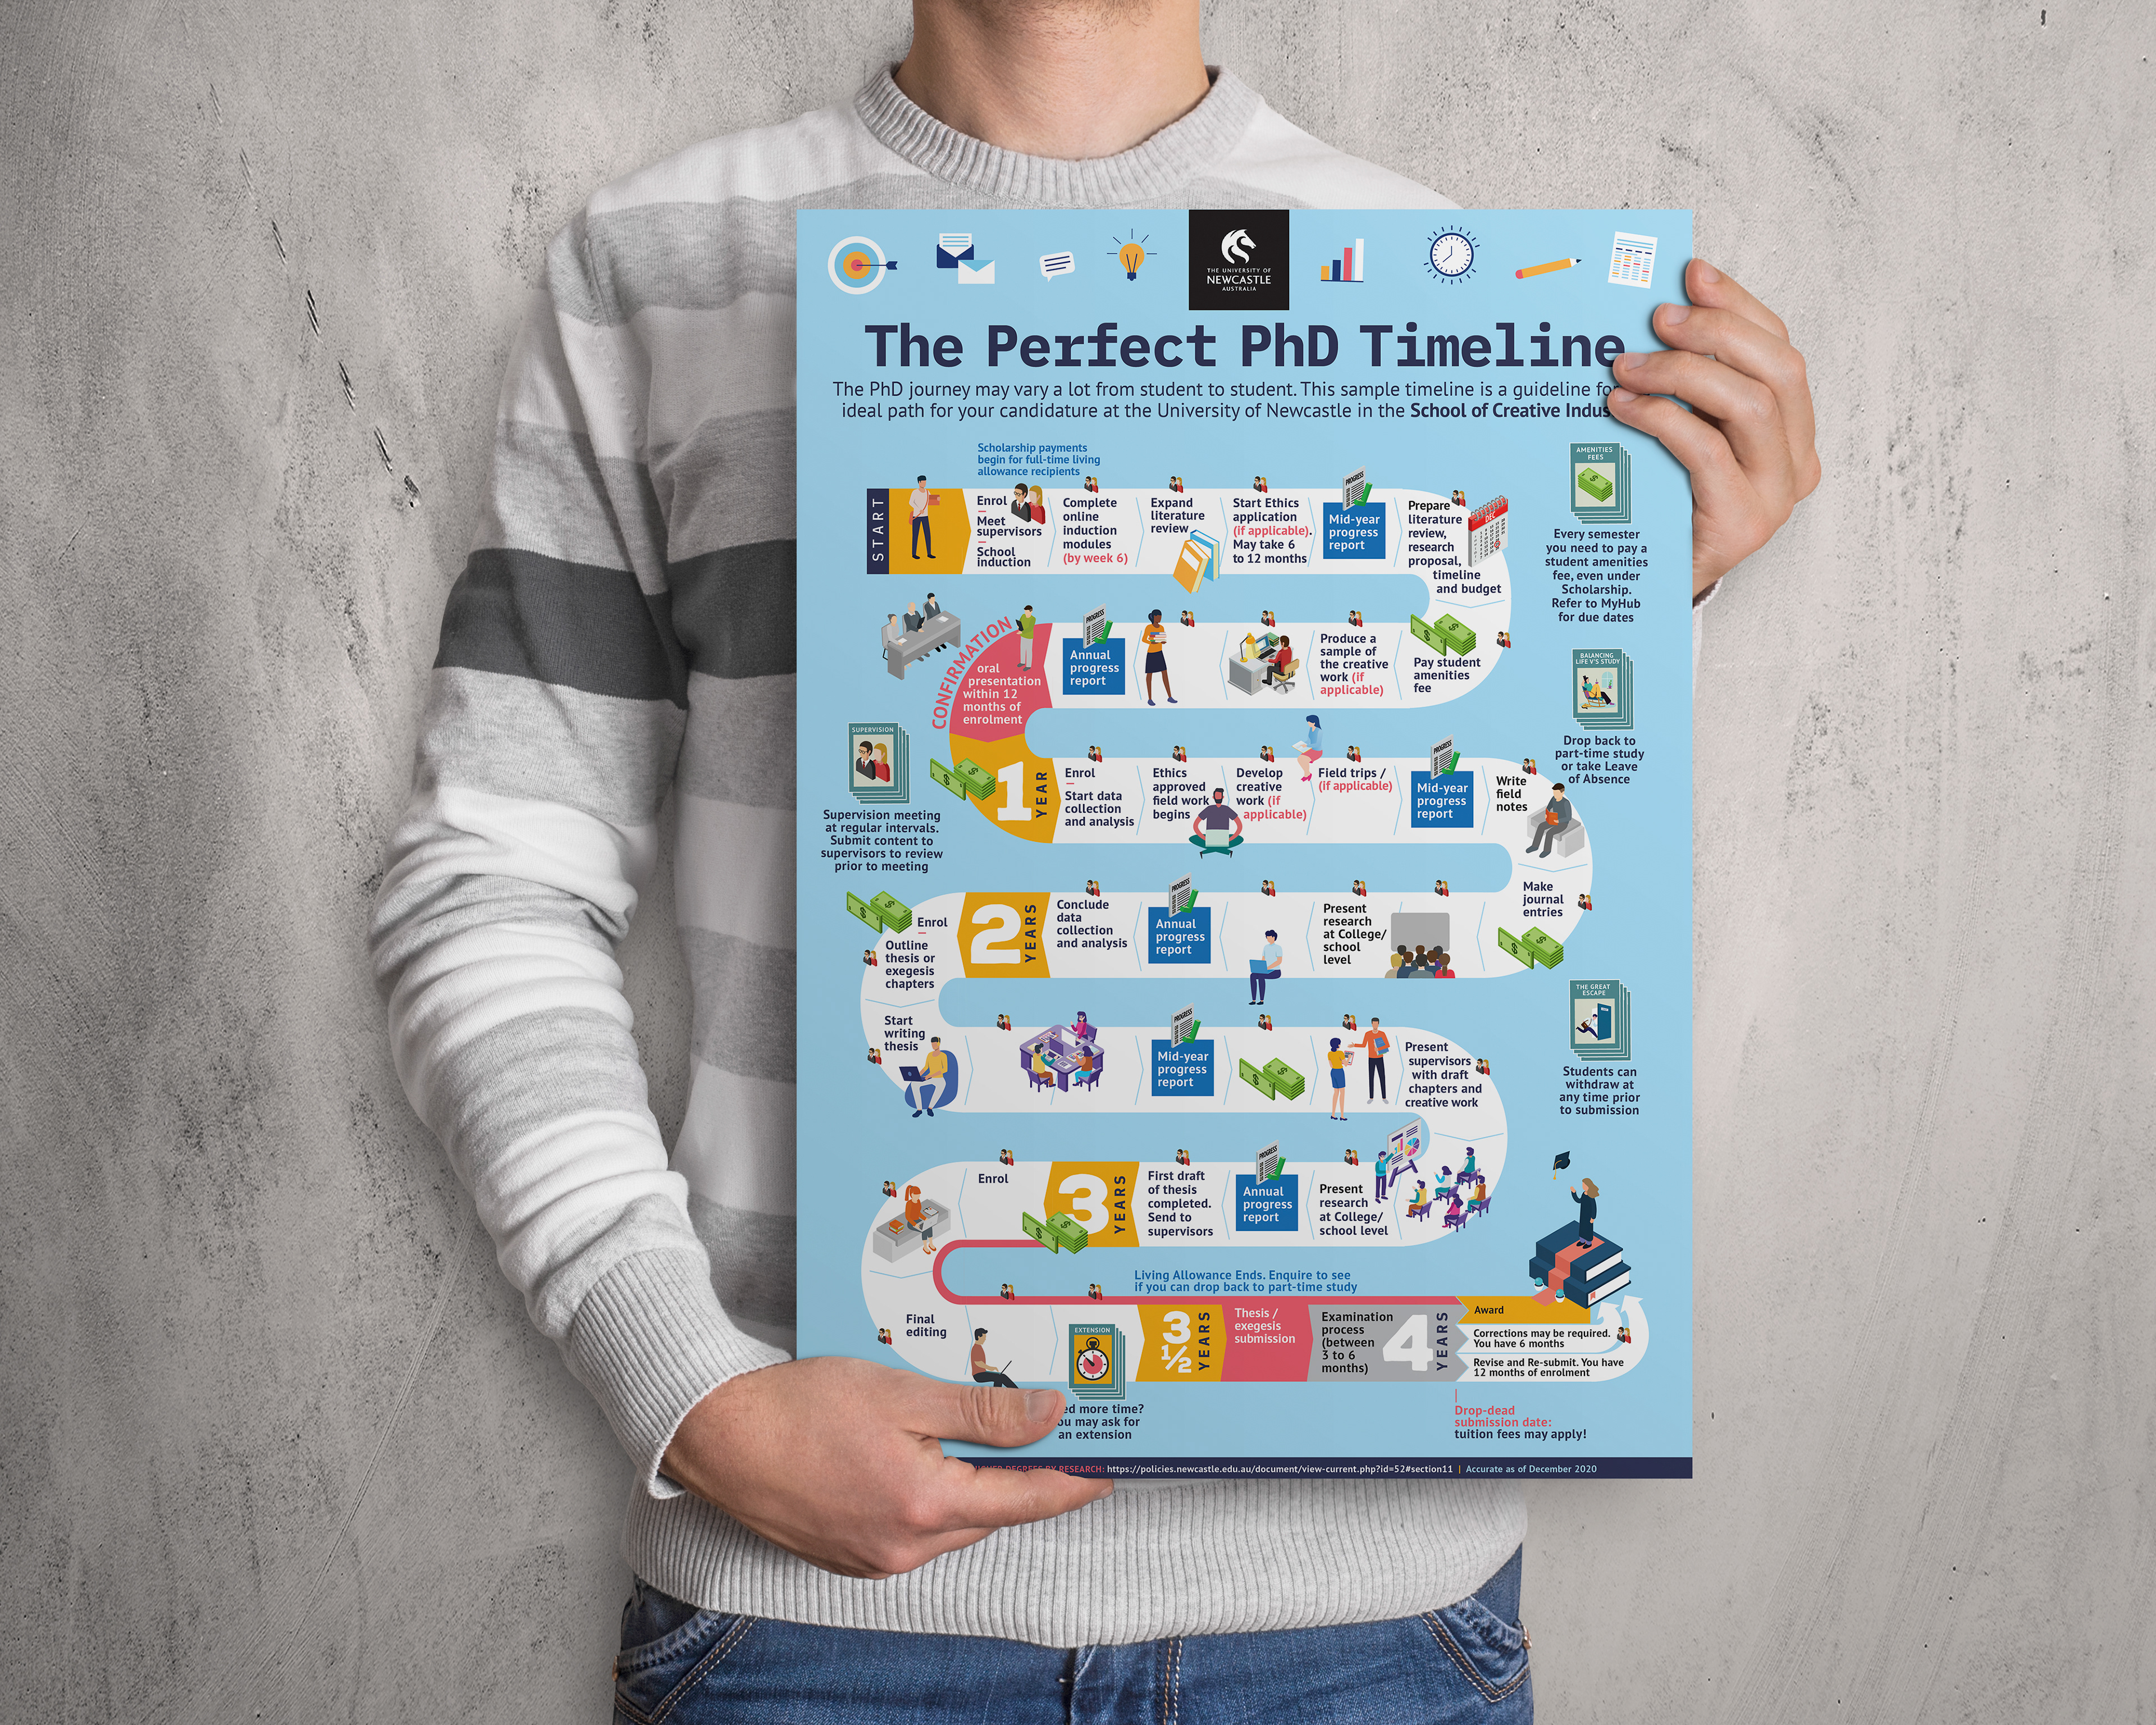
As part of the welcome kit for new PhD students at the University of Newcastle Australia, students from the School of Creative Industries receive a booklet containing essential information about their candidature. I enrolled in the program in 2017 to undertake a PhD in Design. In 2019, the Deputy Head of School hired me to create a printable poster featuring an ideal PhD journey’s key milestones to help students keep on tracks. The previous booklet contained a simplified timeline with only a few items.

With more detailed information provided by the A/Prof Susan Kerrigan it was possible to transform that timeline into an infographic. To make it more fun and increase engagement, I decided to create a DataViz based on board games. Each square represents a month, and actions that might occur at any time were displayed aside as quest cards.